Cashless System > Statistics
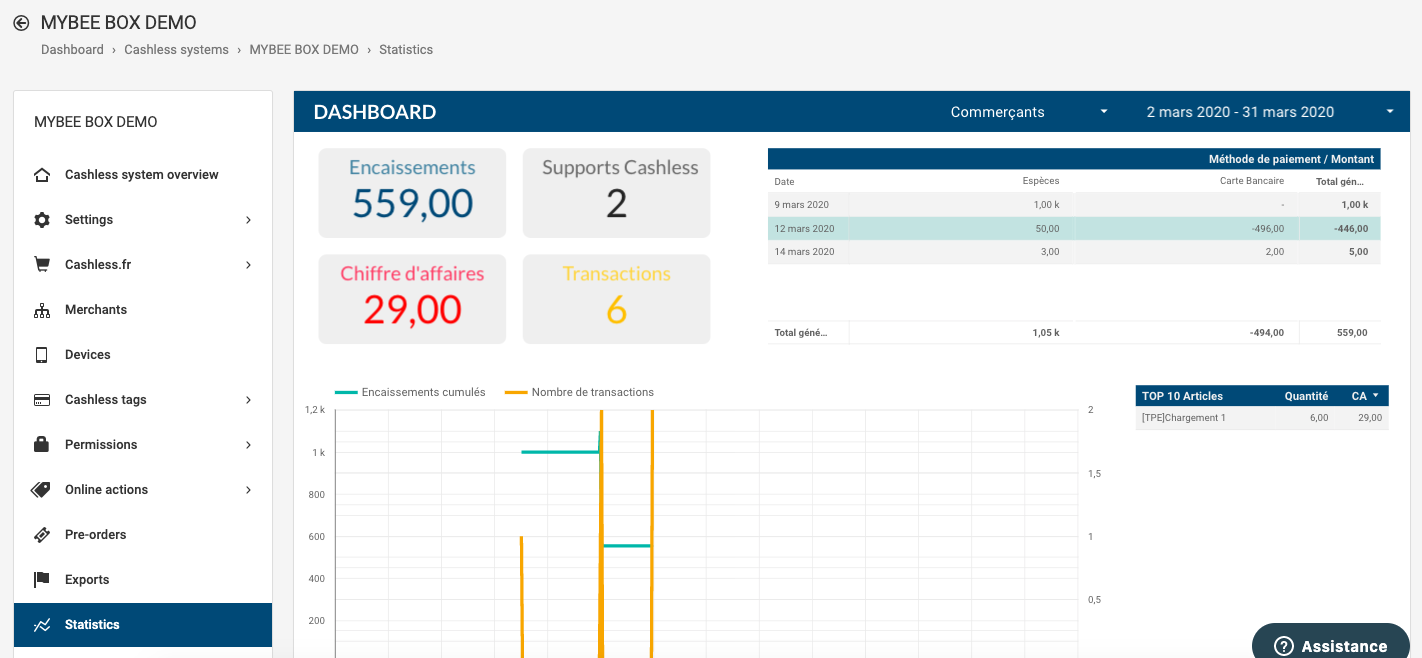
The Google Data Studio dashboard allows you to analyze your sales data at a glance.
You can always filter data on a given date range or on a merchant only with the filters in the top right corner.
Move your mouse at the bottom of the dashboard so you can navigate on the different pages.
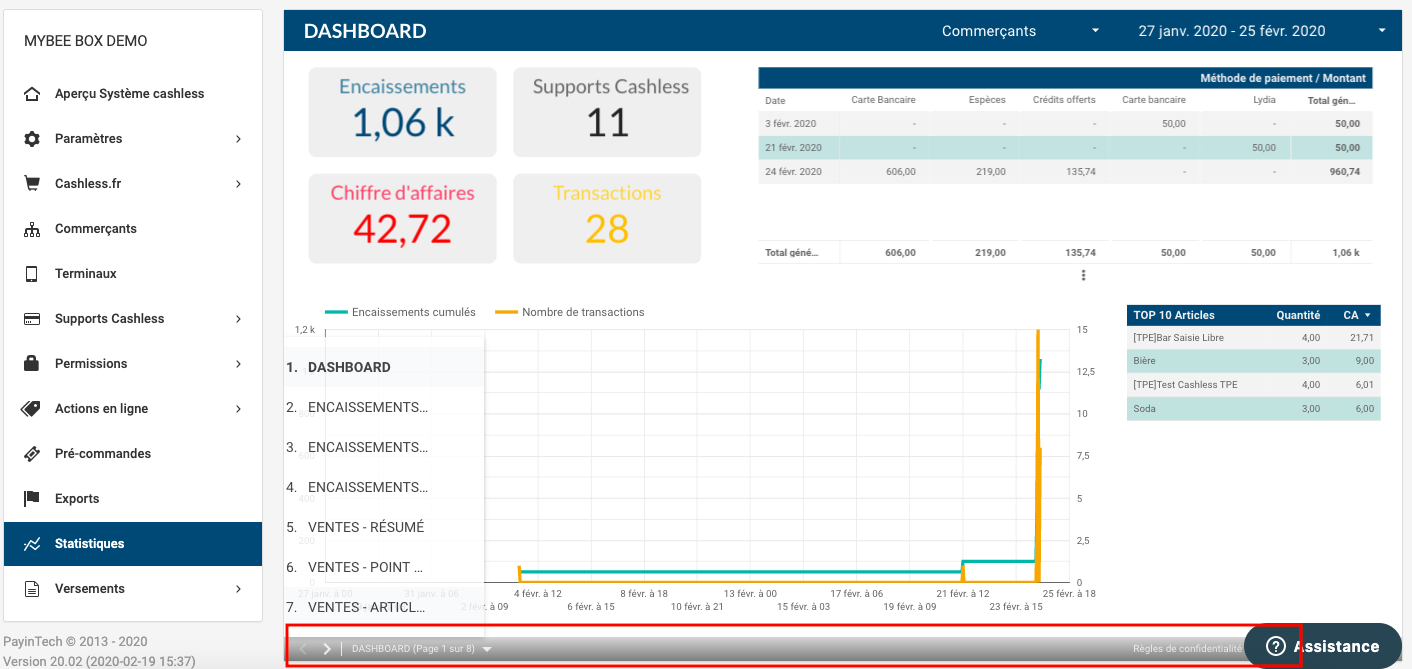
You can dynamically intervene on point-of-sale lists, articles or sellers.
You can also download the dashboard in .pdf by right clicking in a blank space (where there is no graph). Then click on "Save in .pdf" and choose the pages you want to download.
You also can download any graph in .csv by right clicking on the graph you want to download and click on "Save in .csv".